Equation discovery
Find the equation in your data.
Upload your data. Get a model you can read.
You don't choose the form of the curve: Diafunc searches for it, across all your input columns at once.
Curve fitting and nonlinear regression tune the constants of a form you picked. Here the form itself is discovered, and the result is a few readable lines, scored on rows the search never saw. The method is called Symbolic Regression.
- · A model you can read
- · Its quality, measured on rows it never saw
- · A full report in plain language
- · Your questions, answered
- · Ready to use: as code, as an API, as a PDF report
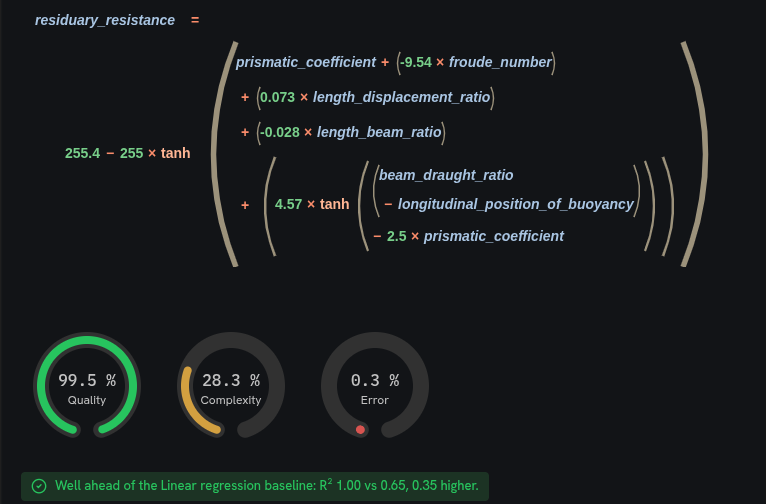
Discovered model

Well ahead of the Linear regression baseline: R² 1.00 vs 0.65, 0.35 higher.
Hosted in the EU Private by default Cancel anytime